
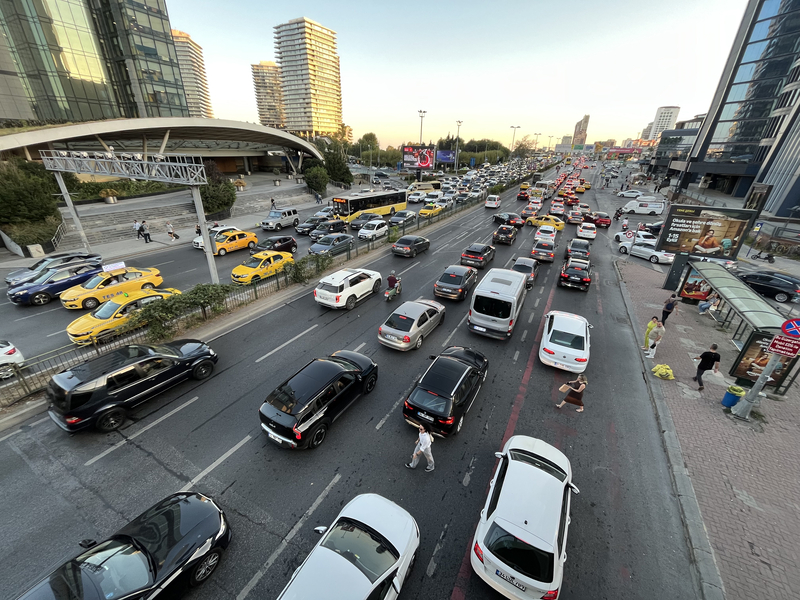
Turkiye’s financial center Istanbul tops the list of the most-congested urban areas for the second straight year, according to the Inrix 2025 Global Traffic Scorecard. Traffic delays in Istanbul in 2025 jumped 12% from the 2024 level, with a typical driver being stuck in congestion for 118 hours.
In contrast to Istanbul, the typical US driver lost 49 hours to traffic congestion, a six-hour jump over 2024, which resulted in $894 worth of time lost per driver.
The 2025 Inrix Global Traffic Scorecard findings provide road authorities, transportation planners, engineers, policymakers and the public with the ability to monitor and measure traffic in their respective areas. Inrix data spanned 942 urban areas in 36 countries this year. While growing traffic volumes indicate increasing economic activity, congestion has a negative impact on the economy.
Of the urban areas studied, 62% (585) saw increased traffic delays compared to 2024, while 26% (245) experienced a reduction in delay. About 12% (111) of urban areas observed no significant change in traffic congestion levels compared to 2024.
In the UK, drivers lost an average of 59 hours commuting to work, down three hours from 2024. Congestion cost UK drivers on average £822 in lost time, whereas a typical German driver lost 47 hours in traffic jams, a four-hour increase from 2024, equal to €750 per driver.
Congestion cost the US more than $85 billion in 2025, an 11.3% increase from 2024. Comparatively, UK drivers lost £11 billion, down by 5.6% from 2024. Congestion in Germany cost drivers €5.3 billion in time lost, up 8.2% from the previous year.
In the US, Chicago took top spot with 112 hours lost, costing the typical driver $2,063 in lost time and the city as a whole $7.5 billion. London in the UK remained number one despite a 10% reduction in delay from 2024. Drivers there lost about 91 hours to traffic in 2025, equal to £1,252. Across London, this adds to £5.2 billion in lost time. In Germany, Cologne took the top spot with 67 hours in lost time, equal to £919 per driver and €188 million to the city.
Truck trips across the US-Canadian border were down 4.5% between January and August. Inrix truck trips are strongly correlated with truck border shipments counted by the US Customs and Border Patrol, ensuring a quicker, a statistically-sound way to monitor US trade policy impacts. Inrix expects a slight increase through Q3 this year during the recent US government shutdown which ended in November.
In general, some cities, such as Los Angeles, Toronto, London and Paris, saw traffic delays recede, though all still remain some of the most-congested in their respective countries. The UK, as noted, got a bit of a reprieve from traffic pain.
Traffic fatalities numbers improved enough to reduce the fatality rate to pre-covid levels. For the past five years traffic fatalities have increased significantly on US roads. But in cities, there has been a lot of work to reduce speed limits.
Transportation policymakers in the US will soon have a surface transportation reauthorisation bill to pass but uncertainties lie in funding. Trade policy may also affect trucking in the US, noticeable by border crossing data by Inrix.
The most interesting takeaway, according to Inrix, was the absence of growth – and even recession – in delays in some major city areas. More investigation is needed as to the cause, including population shifts, commuting and car ownership habits, as well as analysis of other economic and demographic data.